MIRAGE-e 2 supply side #
Production factors #
Production makes use of five factors: capital, skilled labour, unskilled labour, land and natural resources. Factor endowments are assumed to be fully employed.
Factor supply #
Growth rates of factor supply are:
- Natural resources:
- Constant for sectors other than primary fossil production
- Calibrated in the baseline for primary fossil energy (coal, oil, gas)
- Labor: Exogenous growth based on EconMap, differentiated by skill level
- Land: Endogenous to the model, based on an isoelastic function of the real return to land
- Capital: Endogenous to the model, determined by domestic savings (exogenous share of revenue) and current account (exogenous share of world GDP), both projected by EconMap.
Factor mobility #
Capital, natural resources #
Installed capital and natural resources are sector-specific, so that their rates of return may vary across sectors and regions.
Labour #
Labour is region-specific, but perfectly mobile between sectors (agricultural vs. non-agricultural segmentation to be updated).
Land #
This global factor is distributed across productions based on the assumption that it is a Constant Elasticity of Transformation (CET) function of land demands; this assumption introduces an imperfect mobility of land across uses.
Substitutions in the production chain #
Contrary to previous versions of the MIRAGE-e model, different sectors now have very different production function, mainly due to their different behavior towards non-CO2 emissions. To classify the different sectors and model their production function, MIRAGE-e mainly follows [(:harvard:Hyman2003)]. This results in five potential different production function, that only differ by their top-level nesting (see below):
- Legacy MIRAGE top-tier (used only when aggregation do not follow the requirements for non-CO2 GHGs)
- Fossil production
- Energy-intensive manufacturing
- Agriculture and forest
- Non-energy, non-agriculture production
Top-level of production function #
As pointed ou above, the top-level of production function is different from one sector to the other. The different alternatives are the following:
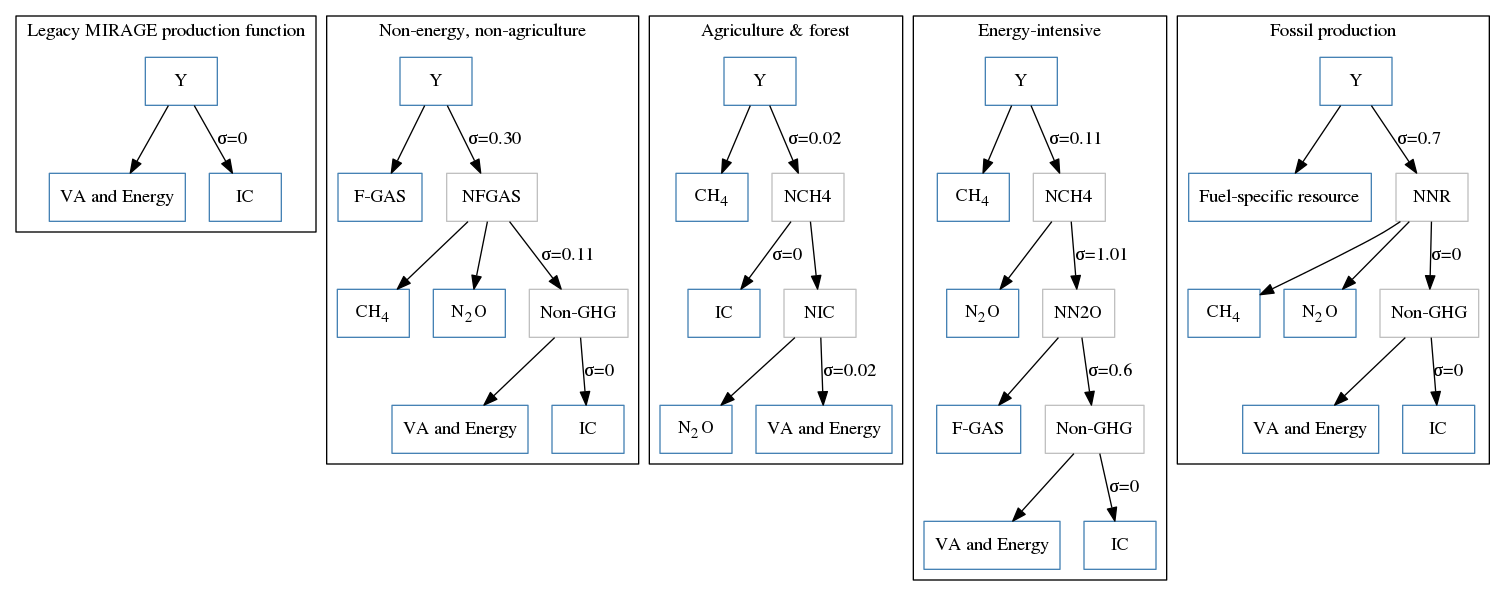
In this figure, each box corresponds to a MIRAGE-e variable and arrows denote the aggregation relation, most often a CES aggregate. Elasticities of substitution are shown with the different values for $\sigma$ ($\sigma=0$ means the functional form is Leontief).
Bundles #
- $Y$ is the total production of a given sector
- $VA$ corresponds to the value-added and energy bundle (see below)
- $IC$ corresponds to the intermediate consumption bundle (see below)
- Other bundles, depicted in light gray, are simple CES bundles of the different components
Non-CO2 greenhouse gases #
Each non-CO$_2$ greenhouse gas (CH$_4$, N$_2$O and fluorinated gases $FGAS$) enter the production function as a component of production : their value is calibrated at the level of CO$_2$-equivalent emissions their generate and an arbitrary small price.
- The elasticity of substitution is chosen following [(:harvard:Hyman2003)], and represents the different abatement costs corresponding to the greenhouse gas.
Fossil-specific resource #
In fossil energy production, the fuel-specific resource is of two different types:
- This is the natural resource $NatRes$ in case of primary fossil energy production (coal, oil, gas)
- This is crude oil in the case of pretroleum and coal products
Value for elasticities #
| Elasticity | Sectors | Value | Comments |
|---|---|---|---|
| $\sigma_{TOP}$ | Standard | 0.30 | EPPA value (for PFC and SF6 ; 0.15 only for HFC) |
| Energy-intensive | 0.11 | EPPA value | |
| Agriculture | 0.02 | Lowest EPPA value (because EPPA elast. include sector substitutions) | |
| Primary fossil fuel | 0.7 | Previous MIRAGE-e value. EPPA Value: 0.6 | |
| Petroleum | 0 | Previous MIRAGE-e value (idem EPPA) | |
| $\sigma_{NFGAS}$ | Standard | 0.11 | EPPA value |
| $\sigma_{NCH4}$ | Agriculture | 0 | Usual CNTER substitution in MIRAGE-e |
| Energy-intensive | 1 | EPPA value | |
| $\sigma_{NIC}$ | Agriculture | 0.02 | Lowest EPPA value (idem $\sigma_{TOP}$) |
| $\sigma_{NN2O}$ | Energy-intensive | 0.6 | EPPA value |
| $\sigma_{NNR}$ | Fossil | 0 | EPPA Value |
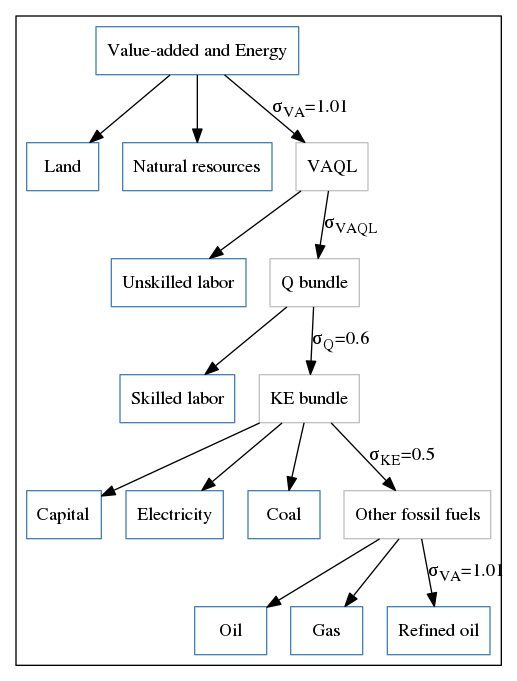
Value-added and energy #
Value-added and energy bundle is identical accross sectors in MIRAGE-e, given that energy in value added is toggles (and aggregation meets the requirements of separating the five energy goods) :
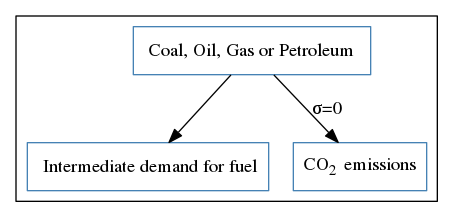
Emissions from CO2-emitting fuels #
For CO$_2$-emitting fuels (coal, oil, gas and refined petroleum), the CO$_2$ emissions are proportional to the volume of fuel demanded:
Intermediate consumption #
Intermediate consumption is identical accross sectors :
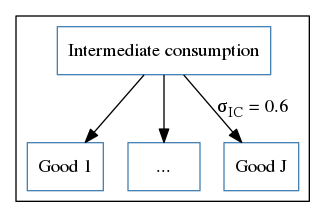
The demand for good by origin is presented in the Trade page.