MIRAGE-Power supply side
Power specific features
Power (the aggregate electricity commodity) is generated from multiple sources, including renewables (i.e., hydro, solar, wind, and others), nuclear, coal, oil, and gas. The regional/national power producer provides electricity for firms and households. Electricity as such can also be traded—meaning that the utility can export or import aggregate electricity (indifferently coming from the different generation sources).
Power supply/electricity activity demand
Power production in region r follows the nesting structure below: 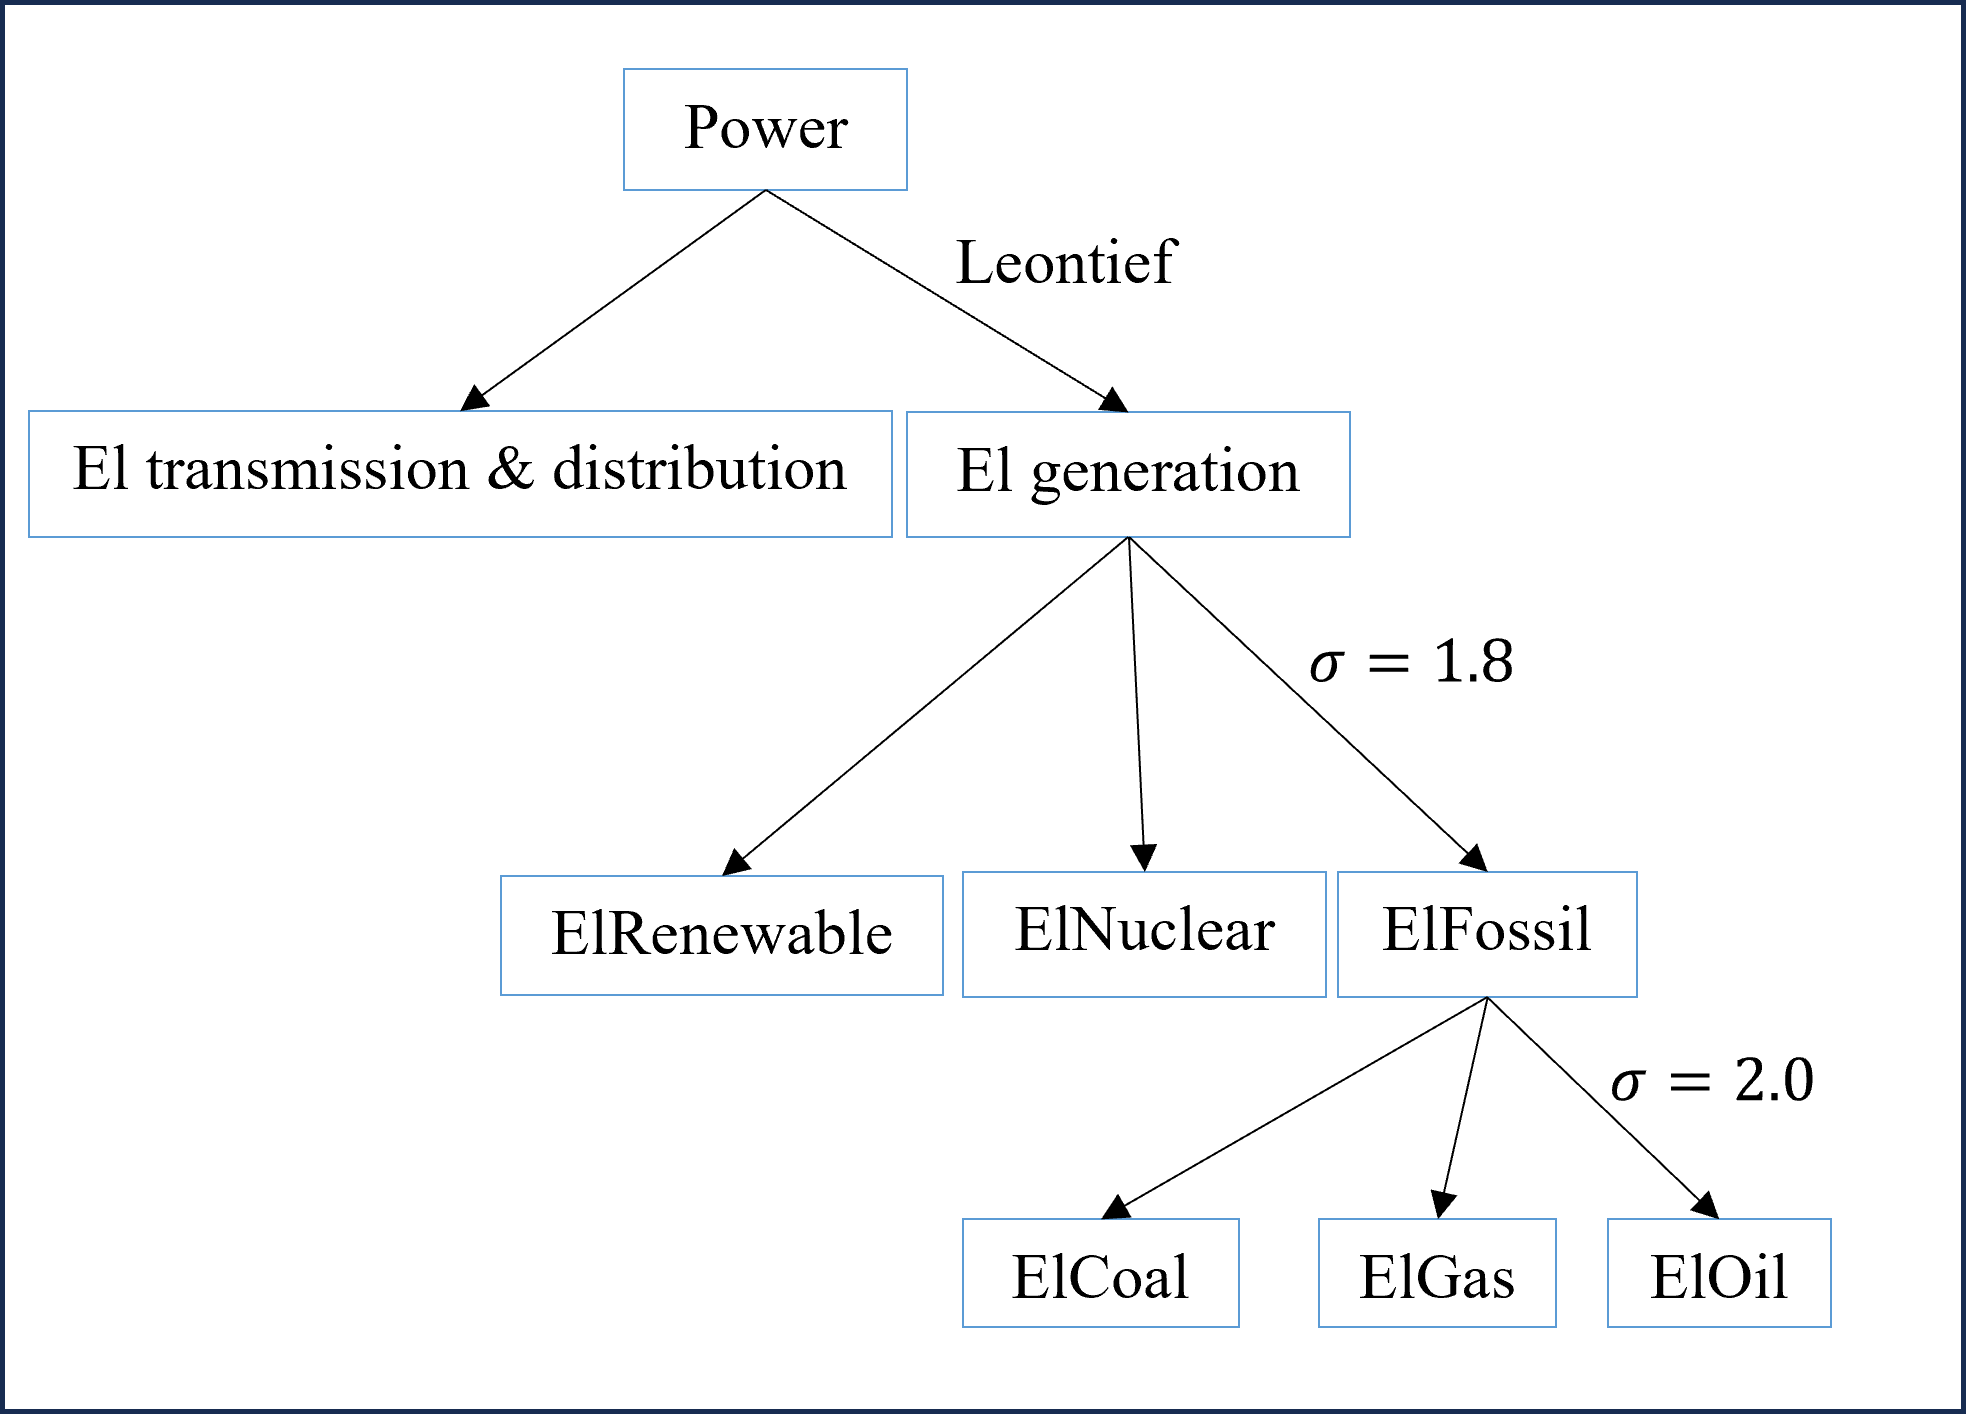
The demand for electricity activities in region \(r\) is only from the power producer in region \(r\). We do not trade the lower-level electricity activities.
Electricity activity supply
The production of the electricity activities follows the standard MIRAGE production function.
Substitutions in the production function
Contrary to previous versions of the MIRAGE-e model, different sectors now have very different production functions, mainly due to their different behavior towards non-CO\(_2\) emissions. To classify the different sectors and model their production function, MIRAGE-Power mainly follows Hyman et al. (2003). This results in five potentially different production functions, that only differ by their top-level nesting (see below):
- Legacy MIRAGE top-tier
- Standard
- Agriculture and forest
- Energy-intensive manufacturing
- Fossil production
Top-level of production function
As pointed out above, the top-level production function is different from one sector to the other. The different alternatives are the following: 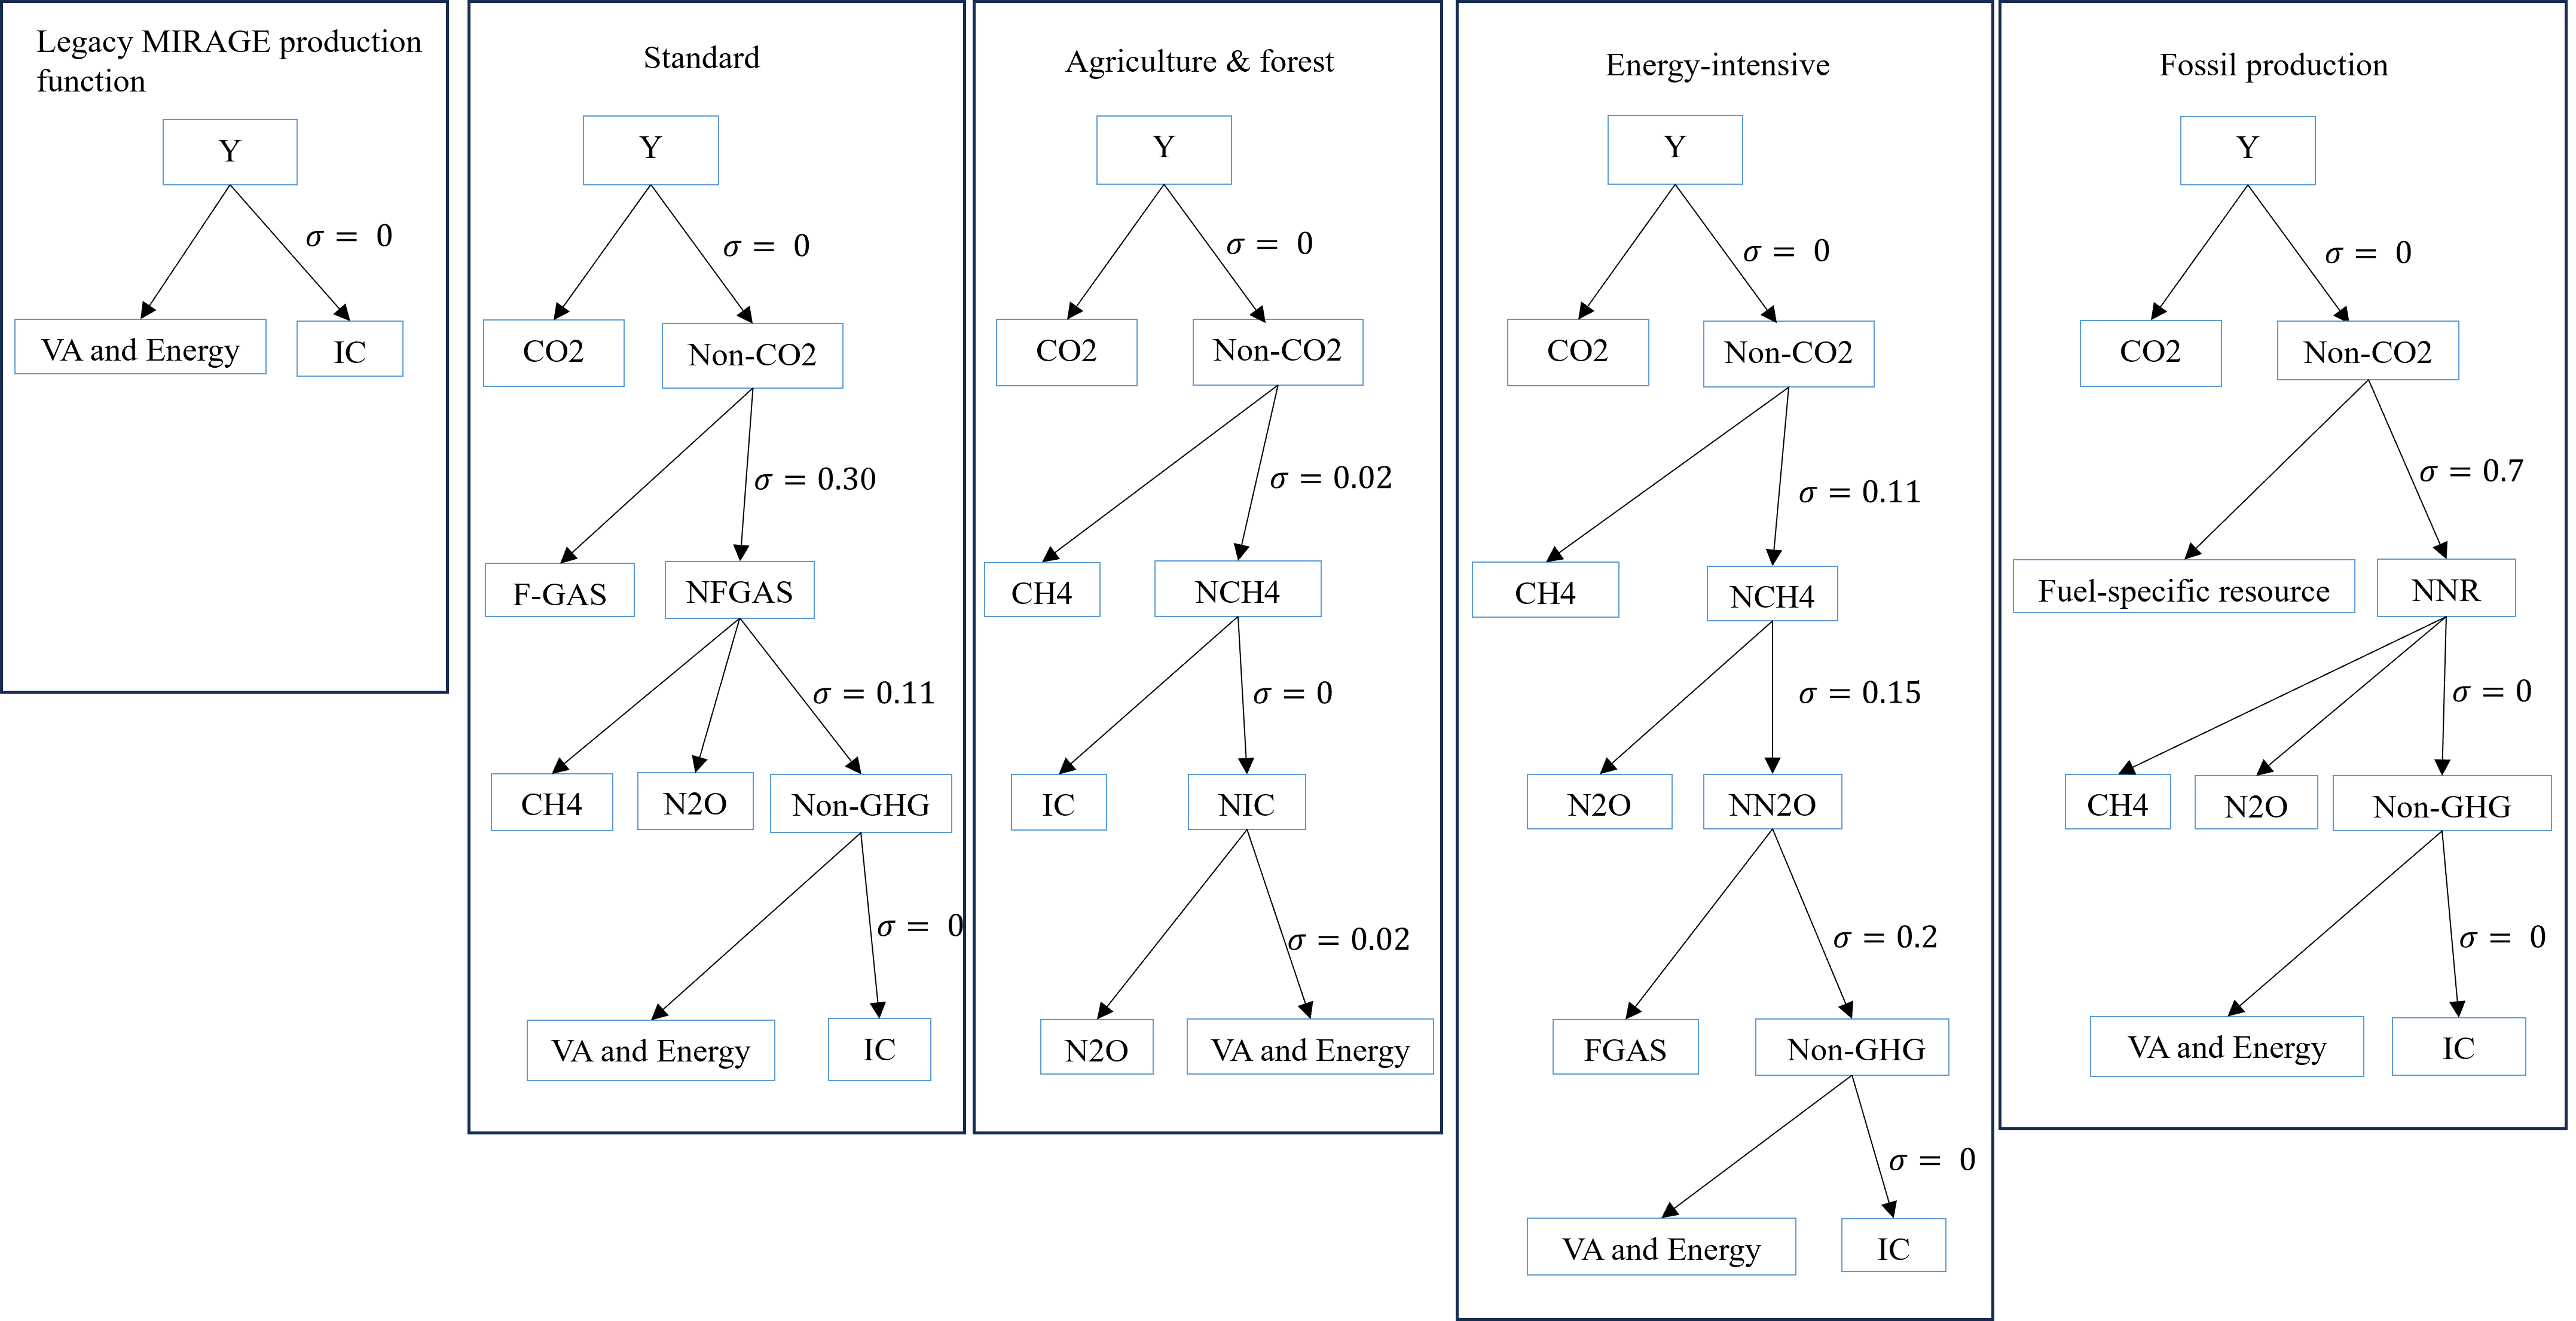
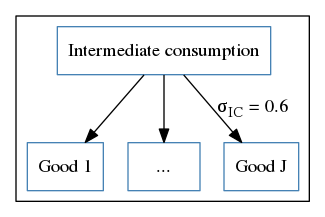
In this figure, each box corresponds to a MIRAGE-Power variable and arrows denote the aggregation relation, most often a CES aggregate. Elasticities of substitution are shown with the different values for \(\sigma\) (\(\sigma=0\) means the functional form is Leontief).
Bundles
- \(Y\) is the total production of a given sector
- \(VA\) corresponds to the value-added and energy bundle (see below)
- \(IC\) corresponds to the intermediate consumption bundle (see below)
- Other bundles, depicted in light gray, are simple CES bundles of the different components
Non-CO2 greenhouse gases
Each non-CO\(_2\) greenhouse gas (CH\(_4\), N\(_2\)O, and fluorinated gases \(FGAS\)) enters the production function as a component of production: their value is calibrated at the level of CO\(_2\)-equivalent emissions they generate, and an arbitrary small price.
The elasticity of substitution is chosen following Hyman et al. (2003) and represents the different abatement costs corresponding to the greenhouse gas.
Fossil-specific resource
In fossil energy production, the fuel-specific resource is of two different types:
- This is the natural resource \(NatRes\) in case of primary fossil energy production (coal, oil, gas)
- This is crude oil in the case of petroleum and coal products
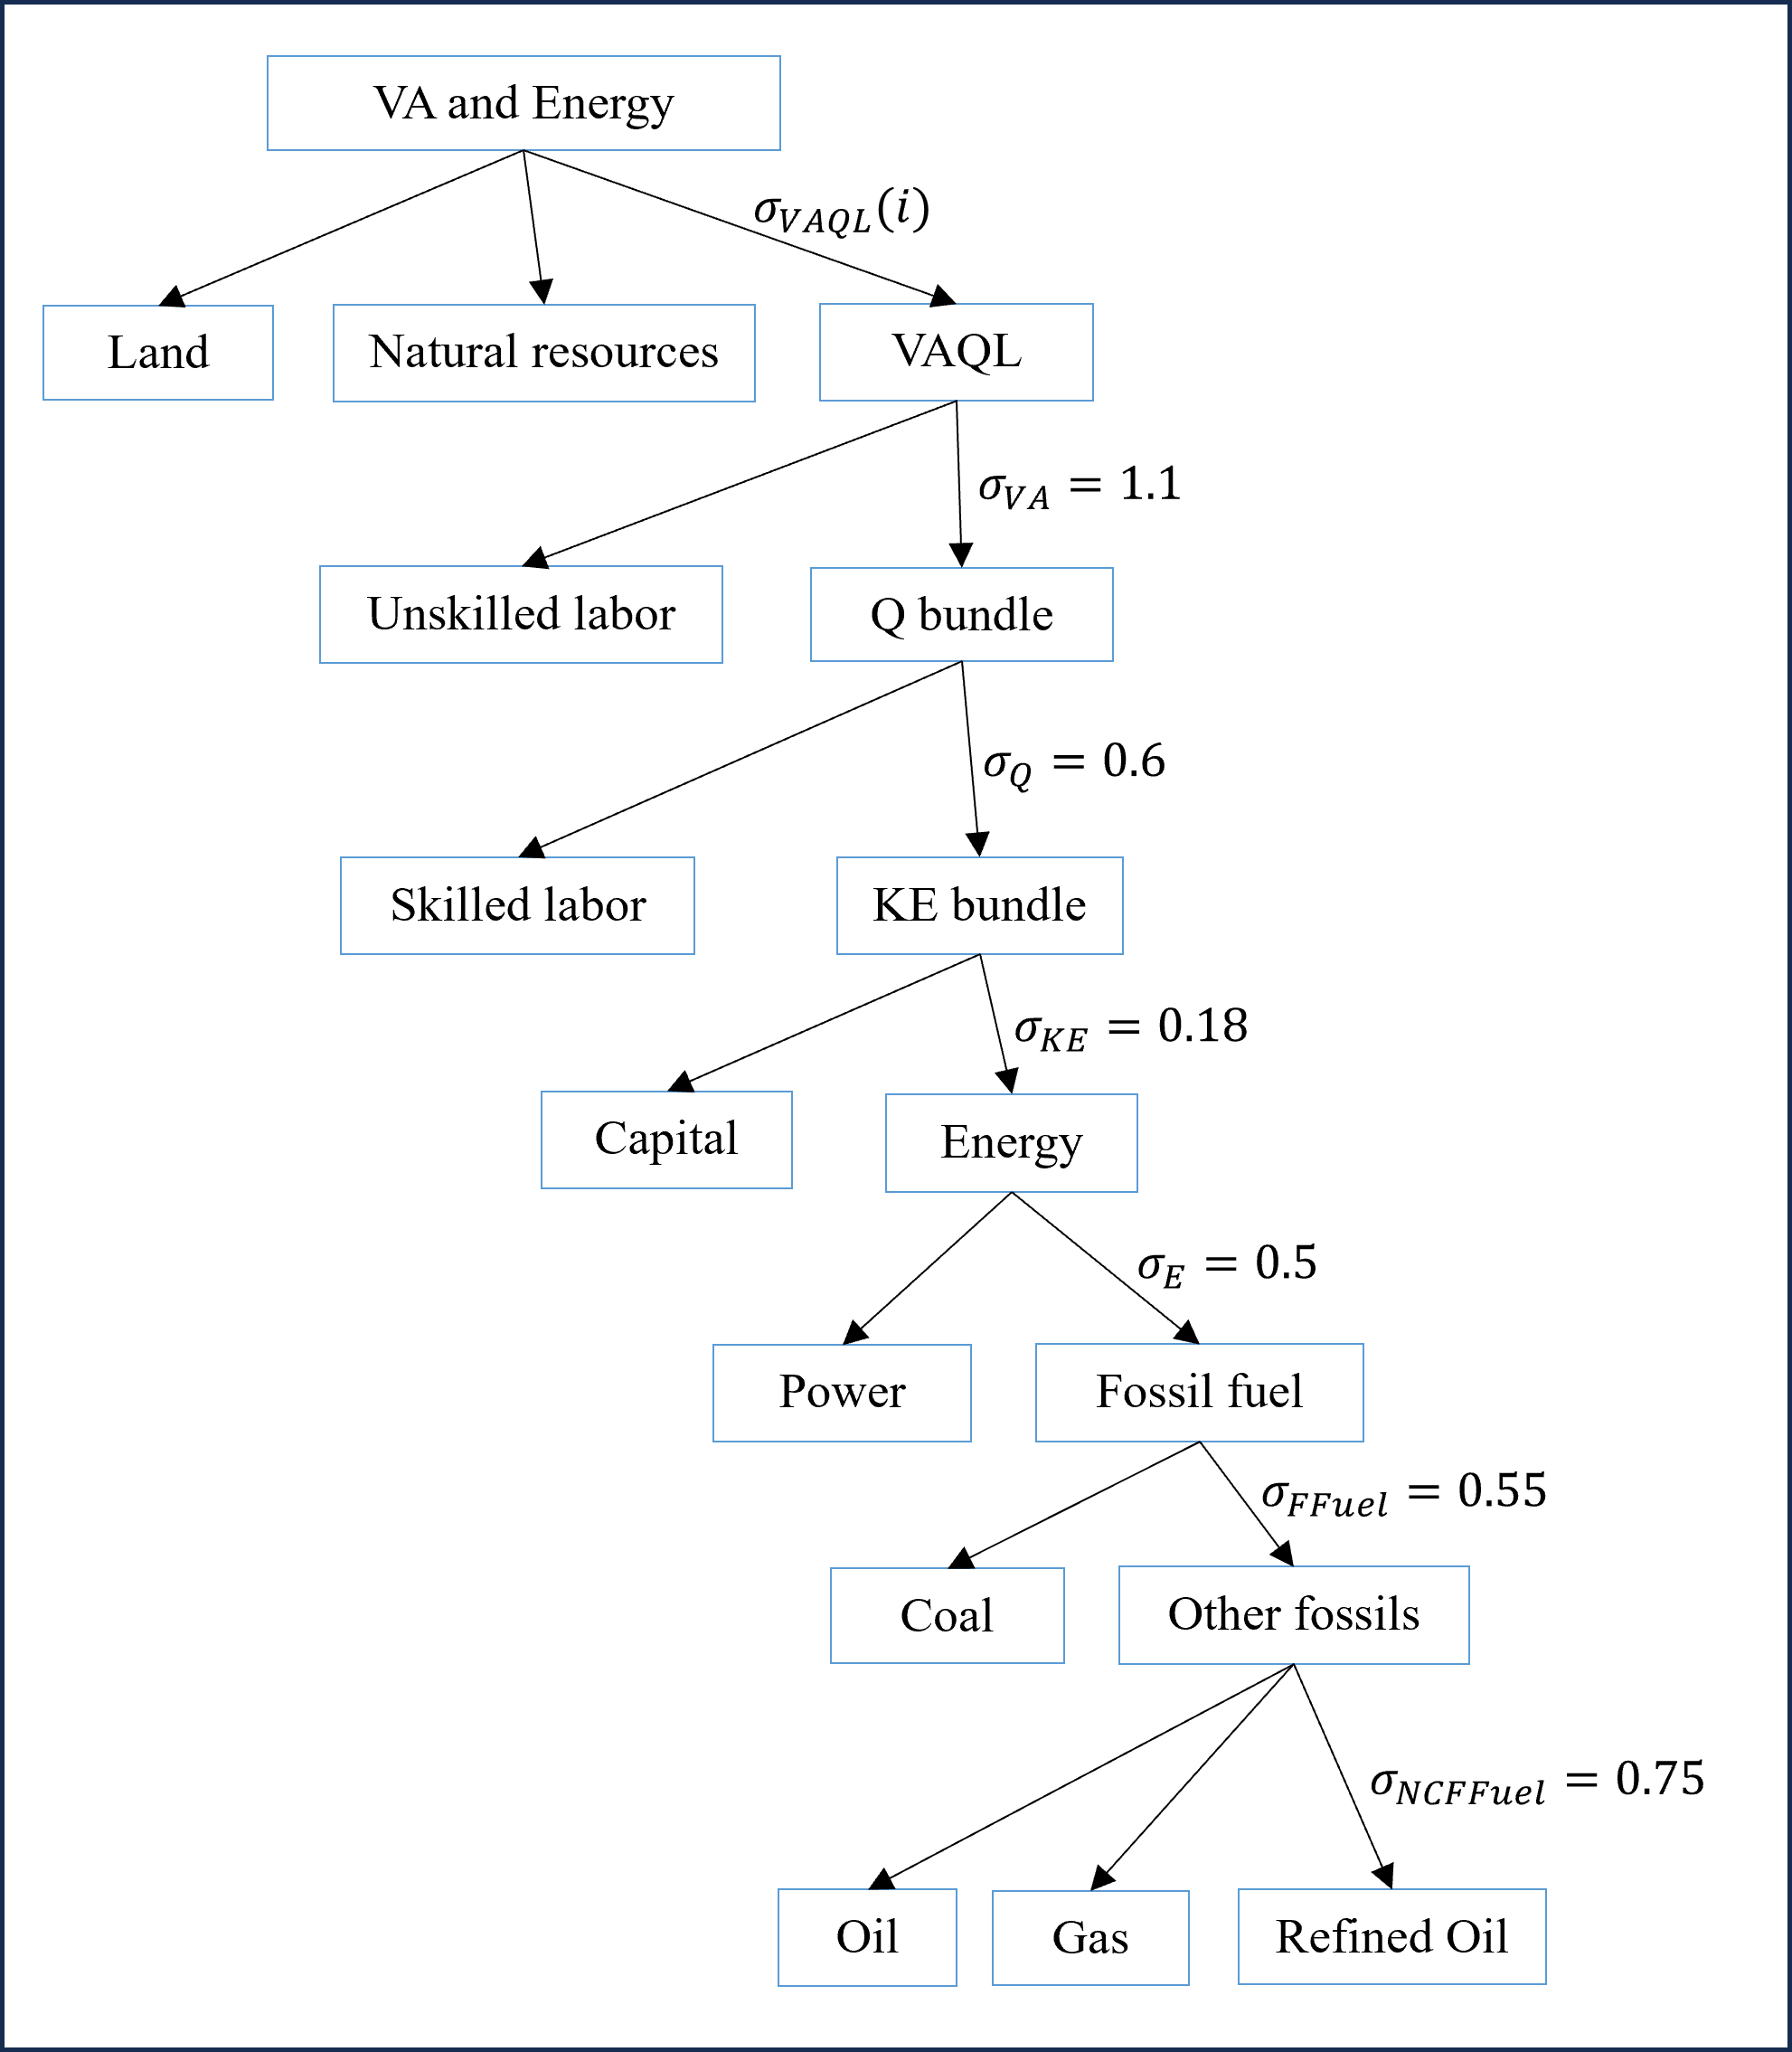
Value-added and energy
Value-added and energy bundle is identical across sectors in MIRAGE-Power:
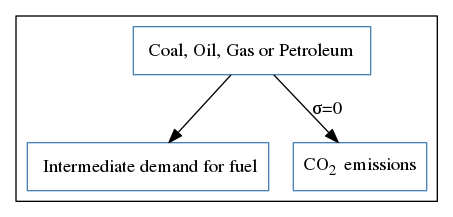
Emissions from CO2-emitting fuels
For CO\(_2\)-emitting fuels (coal, oil, gas, and refined petroleum), the CO\(_2\) emissions are proportional to the volume of fuel demanded:
Intermediate consumption
Intermediate consumption is identical across sectors :
The Trade page presents the demand for goods by origin.